FY27 Financial Indicators Presentation Requires Reading Between the Lines
Every fall for more than a decade Town Hall has produced an annual Financial Indicators Report which has been used to kick off the preparation of a town budget for the coming fiscal year.
While calling out challenges such as revenue limits imposed by Proposition 2 ½ and decreasing real-dollar state aid, the general tone of the presentation has emphasized Amherst’s strong financial position and effective management team.
The Financial Indicators for FY27 presented by Town Manager Paul Bockelman and Finance Director Sean Mangano at the November 3 joint gathering of the Amherst Town Council, Finance Committee, School Committee and Jones Library Board of Trustees followed the pattern. Observers of the presentation may have come away with the impression that Amherst’s finances are on cruise control and that residents should be grateful for past decisions that have placed the town on a firm fiscal footing.
However, the facts on the ground ranging from the second-highest single family property tax bill in Western Massachusetts, to sky-high rents and housing costs, to a 40-plus mile backlog of road repairs tell a different story.
Readers are encouraged to watch the Financial Indicators presentation on YouTube and refer to the slides. Below are a few of the report’s messages that might be considered from a different perspective.
FY26 vs FY27
Last year’s and this year’s Financial Indicators reports led off with a list of challenges, accomplishments and reasons to feel secure about Amherst’s financial foundation. Changes from last year may suggest trends that are guiding the thinking of the town’s financial managers.
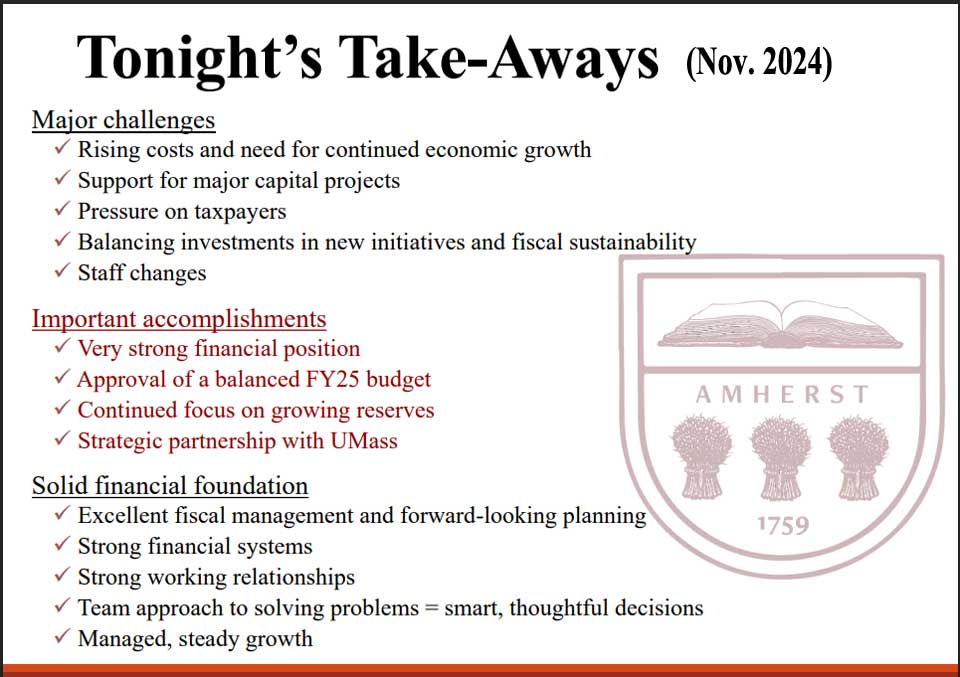
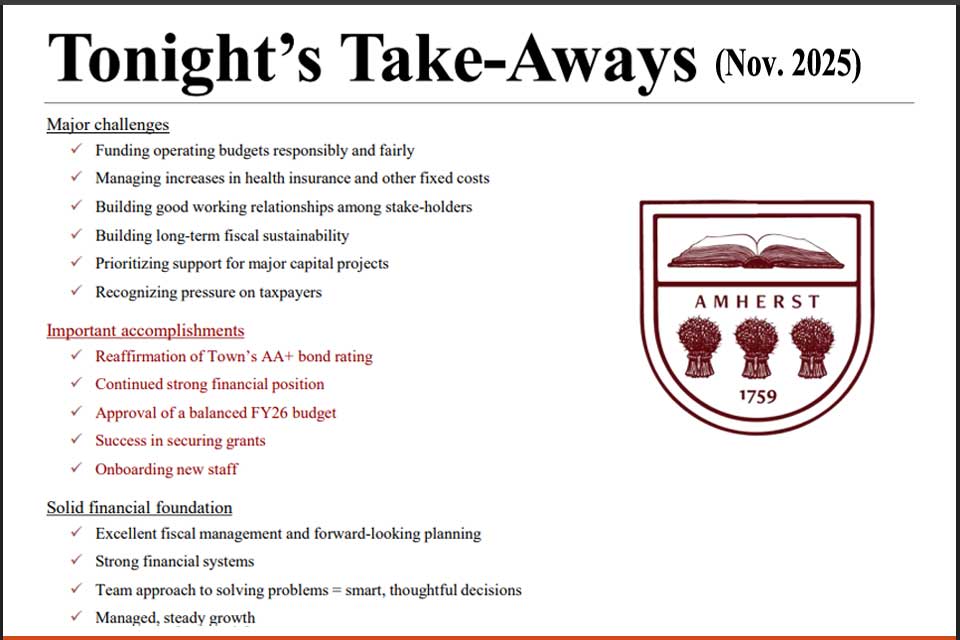
Both reports recognize rising costs, pressure on taxpayers, and fiscal sustainability as challenges. Added to this year’s report is “Building good working relationships among stake-holders.”
This new challenge may indicate concern that the schools feel that they are being asked to cut costs and staff while other budget areas receive more favorable treatment.
“Continued focus on growing reserves” has been dropped from the most recent list of accomplishments. This may be a response to criticism that reserves such as free cash are seen as excessive and negatively impacting operating budgets.
The removal of “Strong working relationships” from the Solid financial foundation section may signal that difficult discussions are anticipated in developing the FY27 budget.
Average Amherst Tax Bill as a Percent of Income Not Indicated
The Financial Indicator report includes charts that show Amherst metrics alongside those of comparable cities, meant to suggest Amherst’s sound financial management.
One example in this year’s report is Operating Expenditures Per Capita.
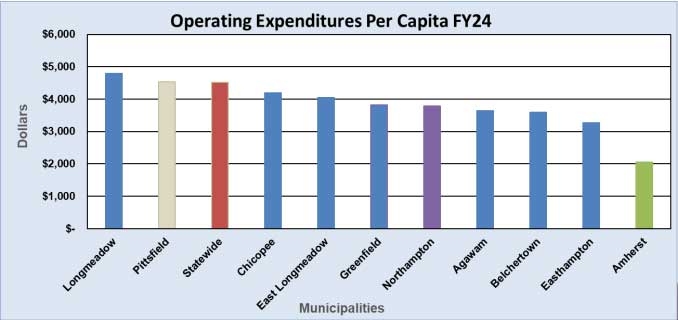
The chart implies that the town has been frugal and has succeeded in squeezing value from limited tax revenues.
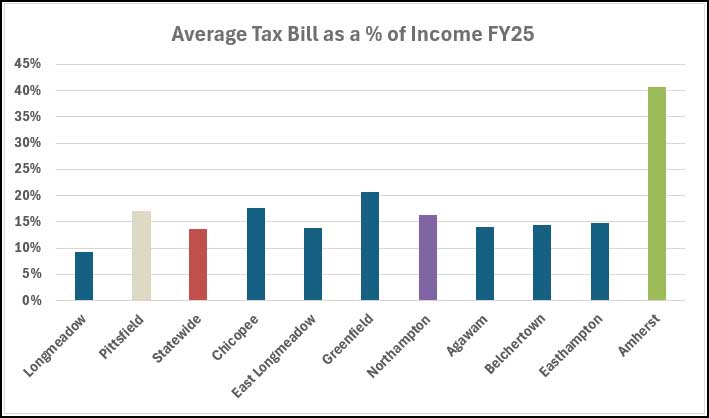
However, a chart that has never appeared in a Financial Indicators presentation is one showing Amherst’s state-highest Average Tax Bill as a % of Income. Such data would put a damper on any suggestion that a Proposition 2 ½ tax override is a viable solution to the town’s money problems.
Economic Growth Is Not a Cure-all
With the arrival of the Town Council form of government, special emphasis has been put on the need for economic development to solve Amherst’s budget shortfalls, high taxes, and unaffordable housing.
Yet a chart included among this year’s Financial Indicators shows a lackluster trend in economic development over the past ten years. Economic Growth in FY25 has barely returned to pre-pandemic levels and is noticeably less than 10 years ago.
This is despite a Planning Board and town leadership that has favored taller buildings, narrower setbacks, minimal parking requirements, few required affordable units, and looser zoning restrictions.
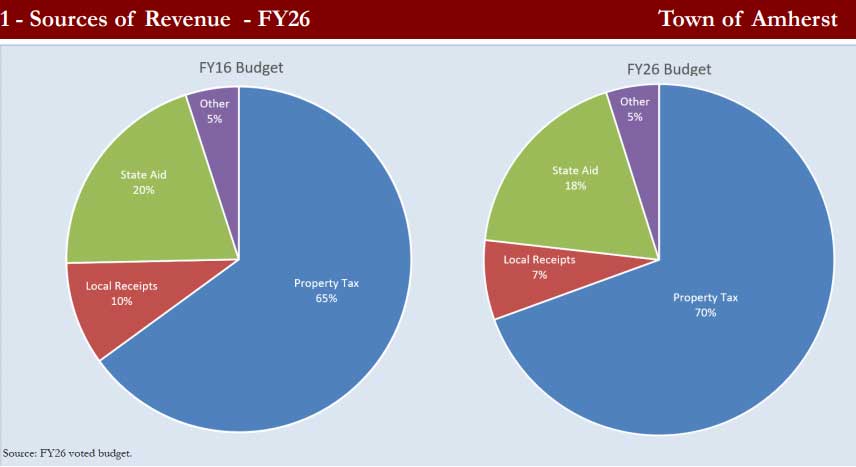
While UMass and Amherst College may have benefitted by the creation of off-campus housing for students, the non-student population of Amherst has seen little improvement. Since 2016 the average single-family tax bill has risen by $2675 to $9693, or a whopping 38%. Family housing has become scarcer and public school enrollment has dropped significantly. Downtown shops are an endangered species and reports of once close-knit Amherst neighborhoods becoming less peaceful and communal have become common.
Jones Library Project Risks Omitted
Amherst leaders’ decision this year to commit more than $50 million to renovate and expand the Jones Library has an obvious effect on the town’s financial future. The private non-profit library, too, is at risk of liquidating its $9.2 million endowment to meet its share of project expenses if capital campaign fundraisers are unable to meet their initial target.
The Financial Indicators presentation avoided the controversy — in the public and on the town council – surrounding the prudence of committing to the large renovation-expansion expense.
Reporting on the capital projects now in progress, Town Manager Paul Bockelman said, “The [new Fort River] school is well under construction, on time and under budget.”
“The library is under construction,” he added.
No Override Proposed
A bit of good news for taxpayers is that the Financial Indicators presentation announced the assumption that there would be no tax override in the coming fiscal year. This follows discussions on the Finance Committee arguing the need to request a Proposition 2 ½ override to bring town roads up to satisfactory condition.
Exactly how the town will meet its many competing needs for funding will be taken up in a series of budget meetings scheduled over the next seven months.
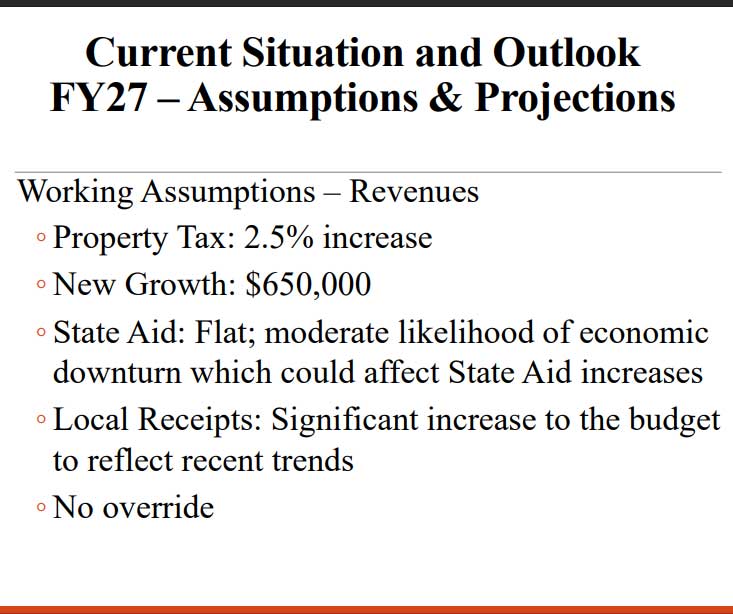
I’ve been given to understand that the Olympia Place fire eliminated $500,000 of property tax. So much for the $650,000 of “New Growth”.
Hmmn…. I know what a “one-liner” is, so I guess this “two-liner” is twice as funny:
Bockelman said, “The [new Fort River] school is well under construction, on time and under budget.”
“The library is under construction,” he added.
I think we should be very careful about the Tax Bill as a Percent of Income measure. Following the link provided, I looked at how other municipalities rank in the state. For 2025 data, if you look at the towns and cities with the lowest percentages on this measure, you’ll see Weston, Dover, Newbury, Wellesley, Sherborn, and Chatham in the top ten, with most of the other being very small towns (the largest of the four has 326 total parcels). Sorting in the other direction, you’ll see some other small towns and then places like Lynn, Holyoke, Brockton, Springfield, and New Bedford. At the very top are Amherst and Tisbury. Tisbury’s average valuation is over $1.6 million and without knowing more details, I’d guess they have an unusual mix of seasonal and year-round residents, and very different incomes in these populations. I’d love to see the standard deviation along with the average, but I’m a nerd.
Without doing a deep analysis of all of the locales and all of the data, it looks like very small towns may have a variety of situations that can put them at either end of the distribution. But once you get into larger municipalities, Amherst is closer to larger cities with more diversity in their populations and in their housing, which makes sense. We are home to a wide range of people who live in single family homes of various sizes and values, multi-family residences, apartment complexes, and student housing. At the other end of the distribution from Amherst, there are much more homogeneous, much wealthier towns, and if we don’t take a strong position to protect access to housing for our diverse population, Amherst will end up looking like them, and that’s not where I want to live.
If someone else has a different read on the data, I’d love to hear it.
I believe that the Mass. Dept. of Revenue tracks Average Tax Bill as a % of Income because it suggests the ability of a municipality’s residents to afford their property tax burden. The number is useful in informing tax policy. It’s true that Amherst has an unusual demographic profile with a preponderance of students who undoubtedly contribute to our low average income, but students are affected by high taxes, too.
If there is a better metric representing the affordability of a community’s property tax, I haven’t come across it.