Letter: Available Data Suggest COVID Transmission In Amherst Schools Is Minimal: A Response To Maura Keene’s Question

Photo: Flckr.com. (CC BY 2.0)
I don’t have an opinion on what format town meetings should take, or more accurately, what metric should be used to decide when they return to in-person. I’m not a public health expert (in fact I have zero training in it, like not even a course). I also want to acknowledge that it’s really hard, as Maura points out, to get detailed data (if it even exists) about where cases are originating and spreading. But my perspective on our town’s school data is that it does not, in fact, suggest a lot of in-school spread, so that Councilor Hanneke’s statement about that seems more likely true than not. (Note that “suggest” is doing a lot of work there.)
The two graphs here show cases at ARHS and in the town over the same period during this current spike–I chose Jan. 10 as the starting point to get a running 7-day average. The schools started reporting data after break on the 4th (so as I understand it the spike at the start includes cases collected over break). What they show is that in fact there appears to be much LESS subsequent spread among HS students than among the town as a whole (remembering that the school cases should also be included in the town data). I haven’t taken the time to plot data from the other schools, but I didn’t cherry pick the HS because it looked “best;” I chose it originally because that’s where I have a kid in school.
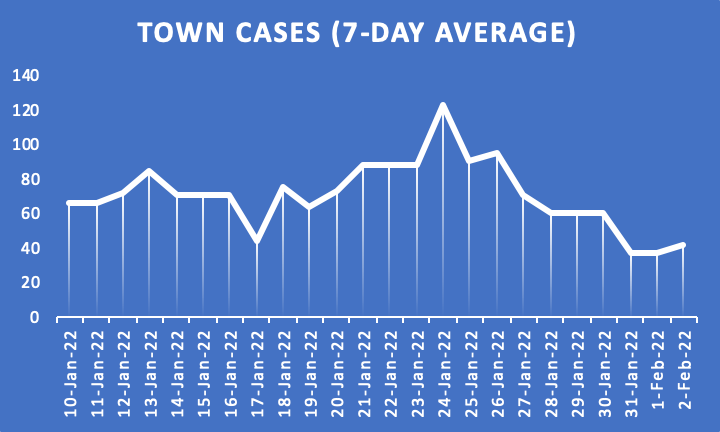
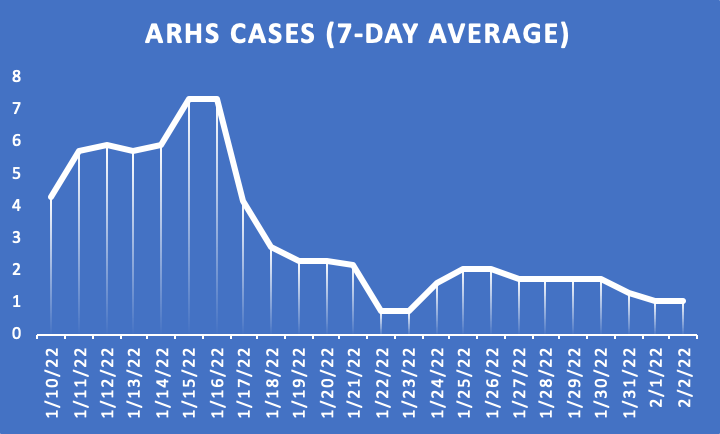
This does not “prove” that there is no spread at the HS, and in fact I’m not sure what data could prove that. (Actual experts are welcome to weigh in!) But it certainly suggests to me that the HS is no worse an incubator than every other activity townspeople are engaged in (and in fact I’d argue it shows that the ~6.5 hours a day the kids are there may be limiting their exposure, although readers should consider that a double “suggest”–maybe kids spread less effectively, period?). I also note that at this point roughly half the students in the district are in pooled testing, so the schools are catching cases that might have gone unnoticed in the general, non-surveillance-tested population (though of course a lot of our town does regular testing through colleges we work at or attend). My limited experience suggests that many households like mine, with adolescent kids, have kids who are socializing (and are therefore potentially exposed to COVID) more than the adults are, in part because parents and guardians are weighing that risk against risks to their kids’ emotional and mental wellbeing. So locally, in my experience when a student catches COVID and their family does not, that student may just as well have been exposed somewhere outside of school, particularly in the case of older kids who have more independent and social lives.
I truly appreciate how much data is public, and kudos to both the schools and the town for maintaining that, but I personally think it would be helpful if the town data were presented in a way that is more easily digestible. On the Amherst town COVID dashboard the active case numbers fluctuate a lot from day to day, and the total cumulative cases don’t tell you what’s going on right now. As my friends know, I’ve been keeping a bunch of running graphs like the ones I include here to show trends over time, which I find more helpful for understanding the current local environment–it would be great if the town found the resources to do that, if we continue to see the need to track case numbers into the future.
Finally, I feel really fortunate to live someplace where there hasn’t been a lot of strife between community members around things like wearing masks. I think the school closing/opening stuff last year was the worst it got, and even then I heard a lot of people prefacing their opinions with acknowledgment of others’ perspectives and feelings. I really hope we as a community can make it through whatever the next stage is, where we move from pandemic to endemic and figure out how to live in a non-crisis state, without turning on each other. Right now people have very different levels of comfort with different measures, and it’s not clear to me that there is often an obvious right answer. To be specific, it is clear that different people (both on and off Town Council) have different opinions on whether or not the Council should be meeting in person right now. It is useful to hear what is behind their thinking, and as long as people aren’t willfully presenting actual misinformation (I don’t think anyone is), I hope we can hear and react to those different viewpoints without disparaging them. Again, I’m not saying this because I think Town Council should or shouldn’t meet in person–as with many things these days, I’m glad I don’t have to decide that.
Kate Queeney
Kate Queeney is a faculty member at Smith College.
Can you please clearify what the vertical axes of your graphs represent?
Is it the 7-day “rolling/running” average of the daily number of COVID-positive cases, or of the weekly number? (Is a factor of 7 missing?)
And how are these specific case numbers determined? Self-reported RATs? PCRTs? Reports from nurses or doctors or clinics? (Pool testing and waste-water testing can inform trends – increases or decreases – but it’s harder to infer specific case numbers from those methods.)
It’s a rolling average of the daily case numbers reported by each entity (ARHS, Town of Amherst). If you’d like to know more specifics about the sources of positive cases, the town provides some detail here: https://www.amherstcovid19.org/#h.48r7z5t7i1fo. I am not 100% sure how the school counts cases, but they seem to coordinate with the town for information.
Thanks!
If the ‘town’ cases include numbers from the colleges, where weekly (and at AC perhaps still biweekly) testing is required for students and staff, then the ‘town’ numbers are likely catching a greater percentage of asymptomatic, presymptomatic, or low-symptomatic cases that in the ‘school’ sample are likely going unrecorded. My understanding is that regular testing among school enrolled children is not now and has never been required. Is that correct?
Eric, I think the short answer to your question is a “maybe,” because the town numbers DO include college numbers, and no, K-12 schools are not requiring screening. However:
1) Amherst College requires testing; you would know better than I about Hampshire (it’s not obvious to me from a quick scroll if they require ongoing testing for everyone after the first weeks of the semester). UMass does NOT require testing of anyone who’s vaccinated, though it seems they’re doing things like using wastewater monitoring to call in certain dorms for testing as needed, plus plenty of people use the voluntary testing (though nothing close to everyone–in the latest week, for example, only 5,398 tests were performed on UMass students/employees). AC/HC numbers are very small relative to town totals, so while they contribute, they are not a major factor in town cases.
2) Because UMass dominates by numbers, I have followed separately the number of student cases there out of curiosity about how much of the town caseload is actually UMass students. And the short answer is: up until the current surge, it was almost certainly almost all UMass students (there are some uncertainties related to where off-camps UMass students live). But in this surge, definitely not. Like to a gross approximation, reported cases among UMass students seem proportional to their share of the town population. I can share those data with you if you’re curious.
3) As I think I said in the original, it’s my understanding that about half our ARPS students are in fact getting asymptomatic “screening” testing through the pooled testing program (I’m actually not sure if that figure is constant across the different schools). Is that lower than the % of town residents currently getting regular screening through one of the colleges or through another workplace? I don’t know.
4) Because UMass provides free and convenient screening, I think it’s OK to assume that more households in Amherst than in other areas will avail themselves of screening. So for example if someone in a household gets a positive test because they’ve been screened at work, it is pretty easy for everyone in that (Amherst–also true e.g. for Hadley) household to then screen by dropping off tests at the town or UMass sites. The schools have advertised this service pretty well. I have no idea how large this phenomenon is; I just know our household and many of our kid’s friends’ households have used it.
5) Finally, because of this and all kinds of other uncertainties, I think it’s dangerous to do too much with absolute numbers (testing rate is a major variable in ALL the case data we have). But if the ARHS data I showed is missing a bunch of asymptomatic cases (and I’m sure it is), the town data is missing those same cases. So my conclusions/suggestions are based on the trends in both, not on absolute numbers (using an assumption that the rate of “missed cases” is pretty constant in each data set).